
Page 118 - Economic report 2020
P. 118
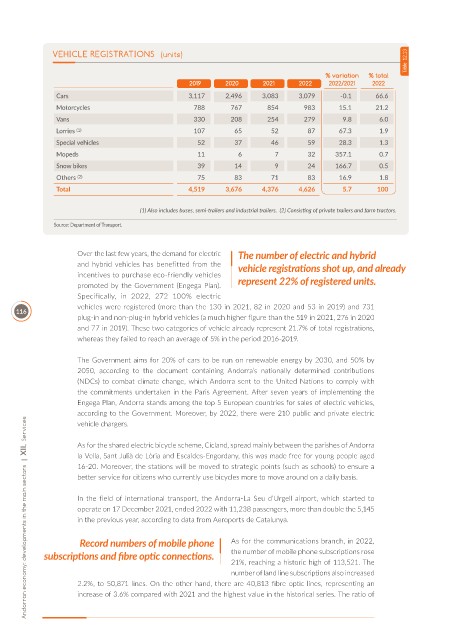
Table  12.13
               VEHICLE REGISTRATIONS  (units)

                                                                                       % variation   % total
                                                   2019     2020      2021      2022    2022/2021  2022
                Cars                               3,117    2,496     3,083     3,079      -0.1     66.6
                Motorcycles                         788       767      854       983      15.1      21.2
                Vans                                330       208      254       279       9.8       6.0
                Lorries  (1)                        107        65       52        87      67.3       1.9
                Special vehicles                     52        37       46        59      28.3       1.3
                Mopeds                               11         6        7        32     357.1       0.7
                Snow bikes                           39        14        9        24     166.7       0.5
                Others  (2)                          75        83       71        83      16.9       1.8
                Total                              4,519    3,676     4,376     4,626      5.7      100


                                      (1) Also includes buses, semi-trailers and industrial trailers.  (2) Consisting of private trailers and farm tractors.
               Source: Department of Transport.


                     Over the last few years, the demand for electric   The number of electric and hybrid
                     and  hybrid  vehicles  has  benefitted  from  the   vehicle registrations shot up, and already
                     incentives to purchase eco-friendly vehicles
                     promoted by the Government (Engega Plan).   represent 22% of registered units.
                     Specifically,  in  2022,  272  100%  electric
                     vehicles were registered (more than the 130 in 2021, 82 in 2020 and 53 in 2019) and 731
     116
                     plug-in and non-plug-in hybrid vehicles (a much higher figure than the 519 in 2021, 276 in 2020
                     and 77 in 2019). These two categories of vehicle already represent 21.7% of total registrations,
                     whereas they failed to reach an average of 5% in the period 2016-2019.

                     The Government aims for 20% of cars to be run on renewable energy by 2030, and 50% by
                     2050,  according  to  the  document  containing  Andorra’s  nationally  determined  contributions
                     (NDCs) to combat climate change, which Andorra sent to the United Nations to comply with
                     the commitments undertaken in the Paris Agreement. After seven years of implementing the
                     Engega Plan, Andorra stands among the top 5 European countries for sales of electric vehicles,
                     according to the Government. Moreover, by 2022, there were 210 public and private electric
        Andorran economy: developments in the main sectors  |  XII.  Services
                     vehicle chargers.

                     As for the shared electric bicycle scheme, Cicland, spread mainly between the parishes of Andorra
                     la Vella, Sant Julià de Lòria and Escaldes-Engordany, this was made free for young people aged
                     16-20. Moreover, the stations will be moved to strategic points (such as schools) to ensure a
                     better service for citizens who currently use bicycles more to move around on a daily basis.

                     In the field of international transport, the Andorra-La Seu d’Urgell airport, which started to
                     operate on 17 December 2021, ended 2022 with 11,238 passengers, more than double the 5,145
                     in the previous year, according to data from Aeroports de Catalunya.

                      Record numbers of mobile phone          As for the communications branch, in 2022,
             subscriptions and fibre optic connections.       the number of mobile phone subscriptions rose
                                                              21%, reaching a historic high of 113,521. The
                                                              number of land line subscriptions also increased
                     2.2%, to 50,871 lines. On the other hand, there are 40,813 fibre optic lines, representing an
                     increase of 3.6% compared with 2021 and the highest value in the historical series. The ratio of