
Page 61 - Economic report 2020
P. 61
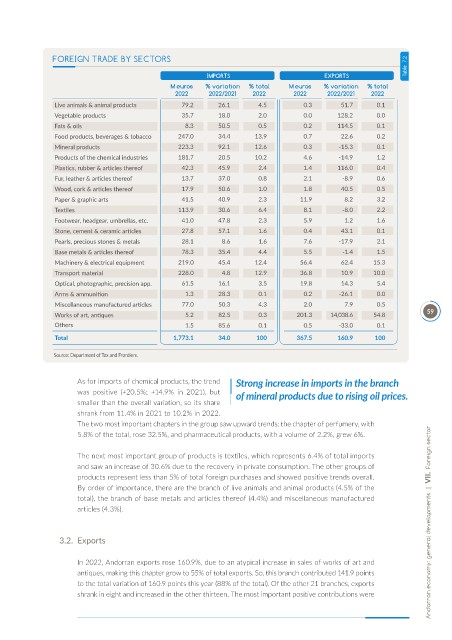
FOREIGN TRADE BY SECTORS                                                                     Table  7.2

                                                       IMPORTS                         EXPORTS
                                              M euros   % variation   % total   M euros   % variation   % total
                                               2022     2022/2021   2022      2022     2022/2021   2022
               Live animals & animal products    79.2      26.1      4.5         0.3       51.7     0.1
               Vegetable products                35.7      18.0      2.0         0.0      128.2     0.0
               Fats & oils                        8.3      50.5      0.5         0.2      114.5     0.1
               Food products, beverages & tobacco  247.0   34.4     13.9         0.7       22.6     0.2
               Mineral products                 223.3      92.1     12.6         0.3      -15.3     0.1
               Products of the chemical industries  181.7  20.5     10.2         4.6      -14.9     1.2
               Plastics, rubber & articles thereof  42.3   45.9      2.4         1.4      116.0     0.4
               Fur, leather & articles thereof   13.7      37.0      0.8         2.1       -8.9     0.6
               Wood, cork & articles thereof     17.9      50.6      1.0         1.8       40.5     0.5
               Paper & graphic arts              41.5      40.9      2.3        11.9        8.2     3.2
               Textiles                         113.9      30.6      6.4         8.1       -8.0     2.2
               Footwear, headgear, umbrellas, etc.  41.0   47.8      2.3         5.9        1.2     1.6
               Stone, cement & ceramic articles  27.8      57.1      1.6         0.4       43.1     0.1
               Pearls, precious stones & metals  28.1      8.6       1.6         7.6      -17.9     2.1
               Base metals & articles thereof    78.3      35.4      4.4         5.5       -1.4     1.5
               Machinery & electrical equipment  219.0     45.4     12.4        56.4       62.4    15.3
               Transport material               228.0      4.8      12.9        36.8       10.9    10.0
               Optical, photographic, precision app.  61.5  16.1     3.5        19.8       14.3     5.4
               Arms & ammunition                  1.3      28.3      0.1         0.2      -26.1     0.0
               Miscellaneous manufactured articles  77.0   50.3      4.3         2.0        7.9     0.5
               Works of art, antiques             5.2      82.5      0.3       201.3    14,038.6   54.8          59
               Others                             1.5      85.6      0.1         0.5      -33.0     0.1
               Total                           1,773.1     34.0      100       367.5      160.9     100

               Source: Department of Tax and Frontiers.


                     As for imports of chemical products, the trend   Strong increase in imports in the branch
                     was  positive  (+20.5%;  +14.9%  in  2021),  but   of mineral products due to rising oil prices.
                     smaller than the overall variation, so its share
                     shrank from 11.4% in 2021 to 10.2% in 2022.
                     The two most important chapters in the group saw upward trends: the chapter of perfumery, with
                     5.8% of the total, rose 32.5%, and pharmaceutical products, with a volume of 2.2%, grew 6%.

                     The next most important group of products is textiles, which represents 6.4% of total imports
                     and saw an increase of 30.6% due to the recovery in private consumption. The other groups of
                     products represent less than 5% of total foreign purchases and showed positive trends overall.
                     By order of importance, there are the branch of live animals and animal products (4.5% of the
                     total), the branch of base metals and articles thereof (4.4%) and miscellaneous manufactured
                     articles (4.3%).                                                                             Andorran economy: general developments  |  VII.  Foreign sector


                 3.2.   Exports


                     In 2022, Andorran exports rose 160.9%, due to an atypical increase in sales of works of art and
                     antiques, making this chapter grow to 55% of total exports. So, this branch contributed 141.9 points
                     to the total variation of 160.9 points this year (88% of the total). Of the other 21 branches, exports
                     shrank in eight and increased in the other thirteen. The most important positive contributions were