
Page 66 - Economic report 2020
P. 66
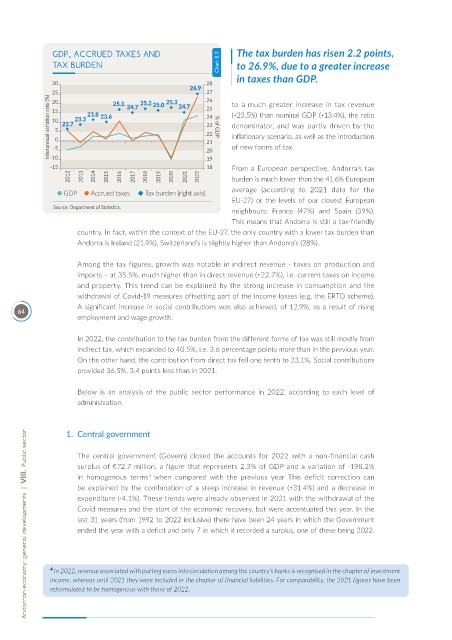
GDP, ACCRUED TAXES AND                          The tax burden has risen 2.2 points,
               TAX BURDEN                                  Chart 8.3   to 26.9%, due to a greater increase
                                                               in taxes than GDP.


                                                              to a much greater increase in tax revenue
                                                              (+23.5%) than nominal GDP (+13.4%), the ratio
                                                              denominator,  and  was  partly  driven  by  the
                                                              inflationary scenario, as well as the introduction
                                                              of new forms of tax.


                                                              From a European perspective, Andorra’s tax
                                                              burden is much lower than the 41.6% European
                  GDP    Accrued taxes  Tax burden (right axis)  average  (according  to  2021  data  for  the
                                                              EU-27)  or  the  levels  of  our  closest  European
               Source: Department of Statistics.
                                                              neighbours:  France  (47%)  and  Spain  (39%).
                                                              This means that Andorra is still a tax-friendly
                     country. In fact, within the context of the EU-27, the only country with a lower tax burden than
                     Andorra is Ireland (21.9%). Switzerland’s is slightly higher than Andorra’s (28%).


                     Among the tax figures, growth was notable in indirect revenue - taxes on production and
                     imports – at 35.5%, much higher than in direct revenue (+22.7%), i.e. current taxes on income
                     and property. This trend can be explained by the strong increase in consumption and the
                     withdrawal of Covid-19 measures offsetting part of the income losses (e.g. the ERTO scheme).
                     A significant increase in social contributions was also achieved, of 12.9%, as a result of rising
      64
                     employment and wage growth.

                     In 2022, the contribution to the tax burden from the different forms of tax was still mostly from
                     indirect tax, which expanded to 40.5%, i.e. 3.6 percentage points more than in the previous year.
                     On the other hand, the contribution from direct tax fell one tenth to 23.1%. Social contributions
                     provided 36.5%, 3.4 points less than in 2021.


                     Below  is  an  analysis  of  the  public  sector  performance  in  2022,  according  to  each  level  of
                     administration.


                  1.   Central government
        Andorran economy: general developments  |  VIII.  Public sector

                     The  central  government  (Govern)  closed  the  accounts  for  2022  with  a  non-financial  cash
                     surplus of €72.7 million, a figure that represents 2.3% of GDP and a variation of -198.2%
                     in  homogenous  terms   when  compared  with  the  previous  year  This  deficit  correction  can
                                        4
                     be explained by the combination of a steep increase in revenue (+31.4%) and a decrease in
                     expenditure (-4.1%). These trends were already observed in 2021 with the withdrawal of the
                     Covid measures and the start of the economic recovery, but were accentuated this year. In the
                     last 31 years (from 1992 to 2022 inclusive) there have been 24 years in which the Government
                     ended the year with a deficit and only 7 in which it recorded a surplus, one of these being 2022.


              4  In 2022, revenue associated with putting euros into circulation among the country’s banks is recognised in the chapter of investment
              income, whereas until 2021 they were included in the chapter of financial liabilities. For comparability, the 2021 figures have been
              reformulated to be homogenous with those of 2022.