
Page 100 - Economic report 2020
P. 100
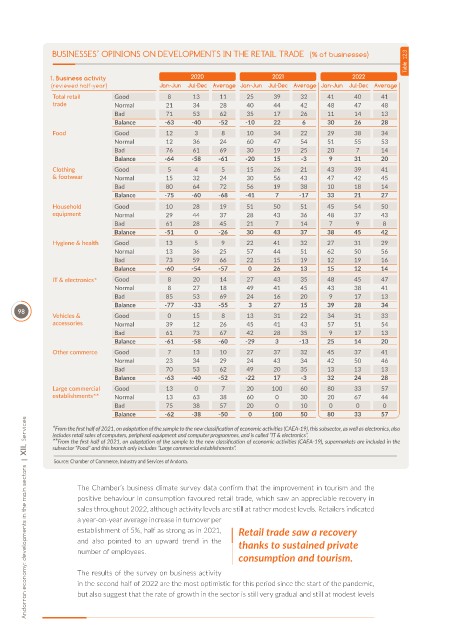
BUSINESSES’ OPINIONS ON DEVELOPMENTS IN THE RETAIL TRADE  (% of businesses)
                                                                                                            Table  12.3

              1. Business activity                 2020                  2021                 2022
              (reviewed half-year)         Jan-Jun  Jul-Dec Average Jan-Jun  Jul-Dec Average Jan-Jun  Jul-Dec Average
               Total retail    Good          8      13     11     25     39     32     41     40     41
               trade           Normal        21     34     28     40     44     42     48     47     48
                               Bad           71     53     62     35     17     26     11     14     13
                               Balance      -63    -40     -52    -10    22      6     30     26     28
               Food            Good          12     3      8      10     34     22     29     38     34
                               Normal        12     36     24     60     47     54     51     55     53
                               Bad           76     61     69     30     19     25     20      7     14
                               Balance      -64    -58     -61    -20    15     -3      9     31     20
               Clothing        Good          5      4      5      15     26     21     43     39     41
               & footwear      Normal        15     32     24     30     56     43     47     42     45
                               Bad           80     64     72     56     19     38     10     18     14
                               Balance      -75    -60     -68    -41    7      -17    33     21     27
               Household       Good          10     28     19     51     50     51     45     54     50
               equipment       Normal        29     44     37     28     43     36     48     37     43
                               Bad           61     28     45     21     7      14      7      9      8
                               Balance      -51     0      -26    30     43     37     38     45     42
               Hygiene & health  Good        13     5      9      22     41     32     27     31     29
                               Normal        13     36     25     57     44     51     62     50     56
                               Bad           73     59     66     22     15     19     12     19     16
                               Balance      -60    -54     -57    0      26     13     15     12     14
               IT & electronics*  Good       8      20     14     27     43     35     48     45     47
                               Normal        8      27     18     49     41     45     43     38     41
                               Bad           85     53     69     24     16     20      9     17     13
                               Balance      -77    -33     -55    3      27     15     39     28     34
      98
               Vehicles &      Good          0      15     8      13     31     22     34     31     33
               accessories     Normal        39     12     26     45     41     43     57     51     54
                               Bad           61     73     67     42     28     35      9     17     13
                               Balance      -61    -58     -60    -29     3     -13    25     14     20
               Other commerce  Good          7      13     10     27     37     32     45     37     41
                               Normal        23     34     29     24     43     34     42     50     46
                               Bad           70     53     62     49     20     35     13     13     13
                               Balance      -63    -40     -52    -22    17     -3     32     24     28
               Large commercial   Good       13     0      7      20     100    60     80     33     57
               establishments**  Normal      13     63     38     60      0     30     20     67     44
                               Bad           75     38     57     20      0     10      0      0      0
                               Balance      -62    -38     -50    0      100    50     80     33     57
        Andorran economy: developments in the main sectors  |  XII.  Services
               *From the first half of 2021, on adaptation of the sample to the new classification of economic activities (CAEA-19), this subsector, as well as electronics, also
               includes retail sales of computers, peripheral equipment and computer programmes, and is called “IT & electronics”.
               **From the first half of 2021, on adaptation of the sample to the new classification of economic activities (CAEA-19), supermarkets are included in the
               subsector “Food” and this branch only includes “Large commercial establishments”.
               Source: Chamber of Commerce, Industry and Services of Andorra.


                     The Chamber’s business climate survey data confirm that the improvement in tourism and the
                     positive behaviour in consumption favoured retail trade, which saw an appreciable recovery in
                     sales throughout 2022, although activity levels are still at rather modest levels. Retailers indicated
                     a year-on-year average increase in turnover per
                     establishment of 5%, half as strong as in 2021,   Retail trade saw a recovery
                     and  also  pointed  to  an  upward  trend  in  the   thanks to sustained private
                     number of employees.
                                                                consumption and tourism.
                     The results of the survey on business activity
                     in the second half of 2022 are the most optimistic for this period since the start of the pandemic,
                     but also suggest that the rate of growth in the sector is still very gradual and still at modest levels