
Page 101 - Economic report 2020
P. 101
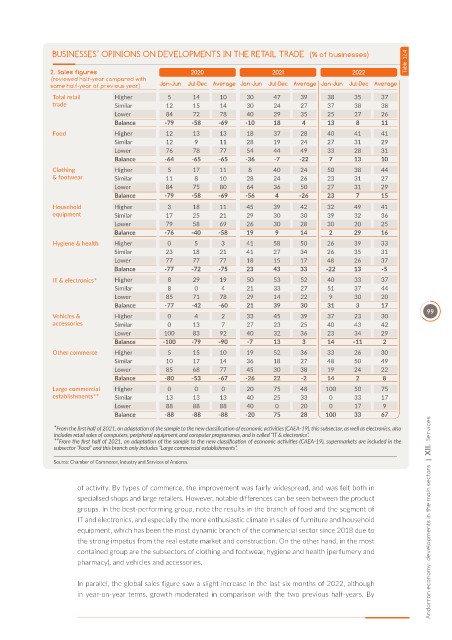
BUSINESSES’ OPINIONS ON DEVELOPMENTS IN THE RETAIL TRADE  (% of businesses)                  Table  12.4

              2. Sales figures                     2020                  2021                 2022
              (reviewed half-year compared with
              same half-year of previous year)  Jan-Jun  Jul-Dec Average Jan-Jun  Jul-Dec Average Jan-Jun  Jul-Dec Average
               Total retail    Higher        5      14     10     30     47     39     38     35     37
               trade           Similar       12     15     14     30     24     27     37     38     38
                               Lower         84     72     78     40     29     35     25     27     26
                               Balance      -79    -58     -69    -10    18      4     13      8     11
               Food            Higher        12     13     13     18     37     28     40     41     41
                               Similar       12     9      11     28     19     24     27     31     29
                               Lower         76     78     77     54     44     49     33     28     31
                               Balance      -64    -65     -65    -36    -7     -22     7     13     10
               Clothing        Higher        5      17     11     8      40     24     50     38     44
               & footwear      Similar       11     8      10     28     24     26     23     31     27
                               Lower         84     75     80     64     36     50     27     31     29
                               Balance      -79    -58     -69    -56    4      -26    23      7     15
               Household       Higher        3      18     11     45     39     42     32     49     41
               equipment       Similar       17     25     21     29     30     30     39     32     36
                               Lower         79     58     69     26     30     28     30     20     25
                               Balance      -76    -40     -58    19     9      14      2     29     16
               Hygiene & health  Higher      0      5      3      41     58     50     26     39     33
                               Similar       23     18     21     41     27     34     26     35     31
                               Lower         77     77     77     18     15     17     48     26     37
                               Balance      -77    -72     -75    23     43     33     -22    13      -5
               IT & electronics*  Higher     8      29     19     50     53     52     40     33     37
                               Similar       8      0      4      21     33     27     51     37     44
                               Lower         85     71     78     29     14     22      9     30     20
                               Balance      -77    -42     -60    21     39     30     31      3     17
               Vehicles &      Higher        0      4      2      33     45     39     37     23     30          99
               accessories     Similar       0      13     7      27     23     25     40     43     42
                               Lower        100     83     92     40     32     36     23     34     29
                               Balance      -100   -79     -90    -7     13      3     14     -11     2
               Other commerce  Higher        5      15     10     19     52     36     33     26     30
                               Similar       10     17     14     36     18     27     48     50     49
                               Lower         85     68     77     45     30     38     19     24     22
                               Balance      -80    -53     -67    -26    22     -2     14      2      8
               Large commercial   Higher     0      0      0      20     75     48     100    50     75
               establishments**  Similar     13     13     13     40     25     33      0     33     17
                               Lower         88     88     88     40      0     20      0     17      9
                               Balance      -88    -88     -88    -20    75     28     100    33     67

               *From the first half of 2021, on adaptation of the sample to the new classification of economic activities (CAEA-19), this subsector, as well as electronics, also
               includes retail sales of computers, peripheral equipment and computer programmes, and is called “IT & electronics”.
               **From the first half of 2021, on adaptation of the sample to the new classification of economic activities (CAEA-19), supermarkets are included in the
               subsector “Food” and this branch only includes “Large commercial establishments”.
               Source: Chamber of Commerce, Industry and Services of Andorra.


                     of activity. By types of commerce, the improvement was fairly widespread, and was felt both in
                     specialised shops and large retailers. However, notable differences can be seen between the product
                     groups. In the best-performing group, note the results in the branch of food and the segment of
                     IT and electronics, and especially the more enthusiastic climate in sales of furniture and household   Andorran economy: developments in the main sectors  |  XII.  Services
                     equipment, which has been the most dynamic branch of the commercial sector since 2018 due to
                     the strong impetus from the real estate market and construction. On the other hand, in the most
                     contained group are the subsectors of clothing and footwear, hygiene and health (perfumery and
                     pharmacy), and vehicles and accessories.

                     In parallel, the global sales figure saw a slight increase in the last six months of 2022, although
                     in year-on-year terms, growth moderated in comparison with the two previous half-years. By