
Page 74 - Economic report 2020
P. 74
The distribution by parish presented a positive trend in revenue overall, except Encamp, where
there was a decline of 5.3%. Among the other parishes, there was a notable increase in Canillo
(+103%) and Escaldes-Engordany (+30.7%). In 2022, Andorra la Vella still led the ranks by volume
of total revenue, with €48.4 million (25% of the total), while Ordino is still the Comú with the least
revenue, 6.9% of the total, equivalent to €13.3 million.
2.2. Expenditure
In 2022, the settled expenditure of the Comú governments saw growth of 8.0%, to €174.9 million, a
trend that moderates the increase recorded in the previous year (+15.4%), but reaches the highest
expenditure figure since 2008. Equally, non-financial expenditure saw an increase of 10.7%,
while financial transactions decreased 12.1% due, above all, to the decrease in expenditure on
financial assets, to which was added a slight increase in financial liabilities. Altogether, this put the
percentage of execution of the total budgeted expenditure for 2022 at 92.5%, lower than the
level of execution for revenue.
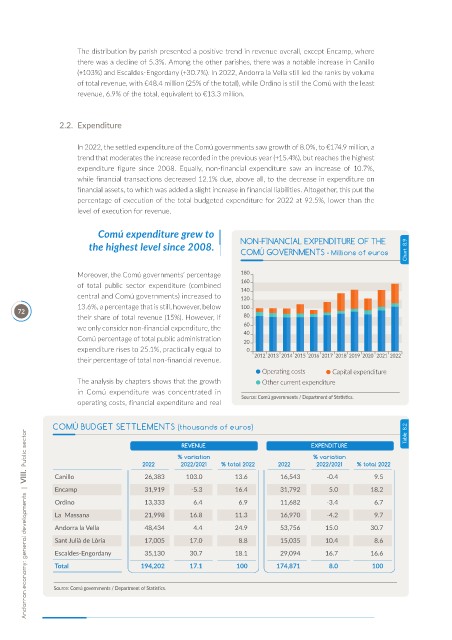
Comú expenditure grew to
the highest level since 2008. NON-FINANCIAL EXPENDITURE OF THE
COMÚ GOVERNMENTS - Millions of euros Chart 8.9
Moreover, the Comú governments’ percentage
of total public sector expenditure (combined
central and Comú governments) increased to
13.6%, a percentage that is still, however, below
72
their share of total revenue (15%). However, if
we only consider non-financial expenditure, the
Comú percentage of total public administration
expenditure rises to 25.1%, practically equal to
their percentage of total non-financial revenue.
Operating costs Capital expenditure
The analysis by chapters shows that the growth Other current expenditure
in Comú expenditure was concentrated in Source: Comú governments / Department of Statistics.
operating costs, financial expenditure and real
Table 8.2
COMÚ BUDGET SETTLEMENTS (thousands of euros)
Andorran economy: general developments | VIII. Public sector
REVENUE EXPENDITURE
% variation % variation
2022 2022/2021 % total 2022 2022 2022/2021 % total 2022
Canillo 26,383 103.0 13.6 16,543 -0.4 9.5
Encamp 31,919 -5.3 16.4 31,792 5.0 18.2
Ordino 13,333 6.4 6.9 11,682 -3.4 6.7
La Massana 21,998 16.8 11.3 16,970 -4.2 9.7
Andorra la Vella 48,434 4.4 24.9 53,756 15.0 30.7
Sant Julià de Lòria 17,005 17.0 8.8 15,035 10.4 8.6
Escaldes-Engordany 35,130 30.7 18.1 29,094 16.7 16.6
Total 194,202 17.1 100 174,871 8.0 100
Source: Comú governments / Department of Statistics.