
Page 80 - Economic report 2020
P. 80
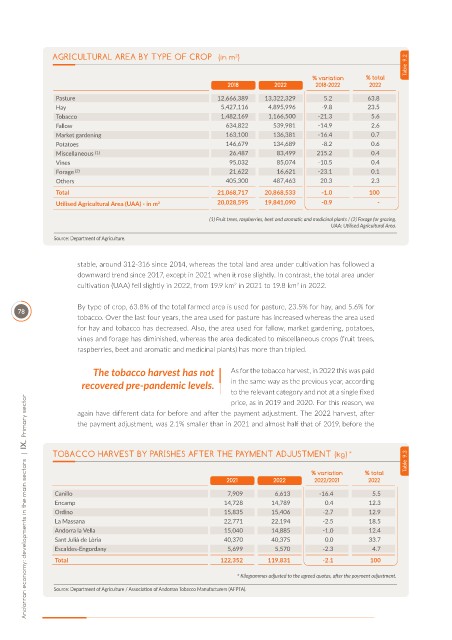
AGRICULTURAL AREA BY TYPE OF CROP  (in m )
                                                               2
                                                                                                            Table  9.2
                                                                                   % variation   % total
                                                             2018        2022       2018-2022     2022
                Pasture                                   12,666,389   13,322,329     5.2         63.8
                Hay                                        5,427,116    4,895,996     -9.8        23.5
                Tobacco                                    1,482,169    1,166,500    -21.3         5.6
                Fallow                                      634,822      539,981     -14.9         2.6
                Market gardening                            163,100      136,381     -16.4         0.7
                Potatoes                                    146,679      134,689      -8.2         0.6
                Miscellaneous  (1)                           26,487       83,499    215.2          0.4
                Vines                                        95,032       85,074     -10.5         0.4
                Forage  (2)                                  21,622       16,621     -23.1         0.1
                Others                                      405,300      487,463     20.3          2.3
                Total                                     21,068,717   20,868,533     -1.0        100
                Utilised Agricultural Area (UAA) - in m 2  20,028,595  19,841,090     -0.9          -
                                                        (1) Fruit trees, raspberries, beet and aromatic and medicinal plants / (2) Forage for grazing.
                                                                                        UAA: Utilised Agricultural Area.
               Source: Department of Agriculture.


                     stable, around 312-316 since 2014, whereas the total land area under cultivation has followed a
                     downward trend since 2017, except in 2021 when it rose slightly. In contrast, the total area under
                     cultivation (UAA) fell slightly in 2022, from 19.9 km  in 2021 to 19.8 km  in 2022.
                                                               2
                                                                               2
                     By type of crop, 63.8% of the total farmed area is used for pasture, 23.5% for hay, and 5.6% for
      78
                     tobacco. Over the last four years, the area used for pasture has increased whereas the area used
                     for hay and tobacco has decreased. Also, the area used for fallow, market gardening, potatoes,
                     vines and forage has diminished, whereas the area dedicated to miscellaneous crops (fruit trees,
                     raspberries, beet and aromatic and medicinal plants) has more than tripled.

                          The tobacco harvest has not         As for the tobacco harvest, in 2022 this was paid
                       recovered pre-pandemic levels.         in the same way as the previous year, according
                                                              to the relevant category and not at a single fixed
        Andorran economy: developments in the main sectors  |  IX.  Primary sector
                                                              price, as in 2019 and 2020. For this reason, we
                     again have different data for before and after the payment adjustment. The 2022 harvest, after
                     the payment adjustment, was 2.1% smaller than in 2021 and almost half that of 2019, before the


               TOBACCO HARVEST BY PARISHES AFTER THE PAYMENT ADJUSTMENT (kg)*
                                                                                                            Table  9.3
                                                                                   % variation   % total
                                                             2021        2022       2022/2021     2022
               Canillo                                       7,909       6,613       -16.4         5.5
               Encamp                                       14,728      14,789         0.4        12.3
               Ordino                                       15,835      15,406        -2.7        12.9
               La Massana                                   22,771      22,194        -2.5        18.5
               Andorra la Vella                             15,040      14,885        -1.0        12.4
               Sant Julià de Lòria                          40,370      40,375         0.0        33.7
               Escaldes-Engordany                            5,699       5,570        -2.3         4.7
               Total                                       122,352      119,831       -2.1         100

                                                               * Kilogrammes adjusted to the agreed quotas, after the payment adjustment.
               Source: Department of Agriculture / Association of Andorran Tobacco Manufacturers (AFPTA).