
Page 33 - Economic report 2020
P. 33
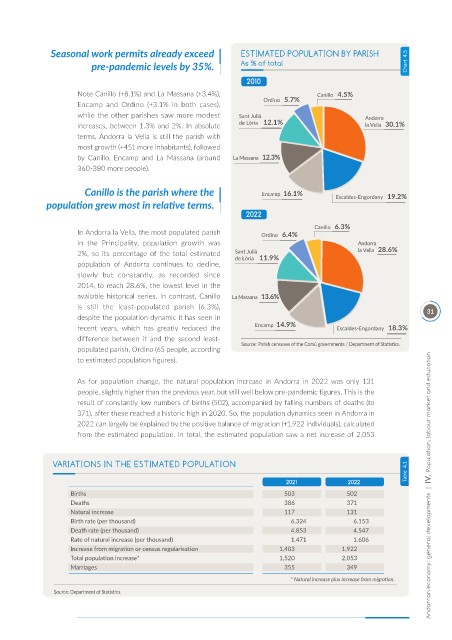
Seasonal work permits already exceed              ESTIMATED POPULATION BY PARISH
                         pre-pandemic levels by 35%.            As % of total                               Chart  4.5

                                                                  2010
                     Note Canillo (+8.1%) and La Massana (+3.4%),
                     Encamp  and  Ordino  (+3.1%  in  both  cases),
                     while the other parishes saw more modest
                     increases,  between  1.3%  and  2%.  In  absolute
                     terms, Andorra la Vella is still the parish with
                     most growth (+451 more inhabitants), followed
                     by  Canillo,  Encamp  and  La  Massana  (around
                     360-380 more people).

                       Canillo is the parish where the
             population grew most in relative terms.
                                                                  2022

                     In Andorra la Vella, the most populated parish
                     in  the  Principality,  population  growth  was
                     2%,  so  its  percentage  of  the  total  estimated
                     population  of  Andorra  continues  to  decline,
                     slowly  but  constantly,  as  recorded  since
                     2014, to reach 28.6%, the lowest level in the
                     available  historical  series.  In  contrast,  Canillo
                     is  still  the  least-populated  parish  (6.3%),                                            31
                     despite the population dynamic it has seen in
                     recent  years,  which  has  greatly  reduced  the
                     difference  between  it  and  the  second  least-  Source: Parish censuses of the Comú governments / Department of Statistics.
                     populated parish, Ordino (65 people, according
                     to estimated population figures).


                     As  for  population  change,  the  natural  population  increase  in  Andorra  in  2022  was  only  131
                     people, slightly higher than the previous year, but still well below pre-pandemic figures. This is the
                     result of constantly low numbers of births (502), accompanied by falling numbers of deaths (to
                     371), after these reached a historic high in 2020. So, the population dynamics seen in Andorra in
                     2022 can largely be explained by the positive balance of migration (+1,922 individuals), calculated
                     from the estimated population. In total, the estimated population saw a net increase of 2,053


               VARIATIONS IN THE ESTIMATED POPULATION                                                       Table  4.1

                                                                            2021             2022                 Andorran economy: general developments  |  IV.  Population, labour market and education
                    Births                                                  503             502
                    Deaths                                                  386             371
                    Natural increase                                        117             131
                    Birth rate (per thousand)                                 6.324           6.153
                    Death rate (per thousand)                                 4.853           4.547
                    Rate of natural increase (per thousand)                   1.471           1.606
                    Increase from migration or census regularisation       1,403           1,922
                    Total population increase*                             1,520           2,053
                    Marriages                                               355             349

                                                                              * Natural increase plus increase from migration.
               Source: Department of Statistics.