
Page 38 - Economic report 2020
P. 38
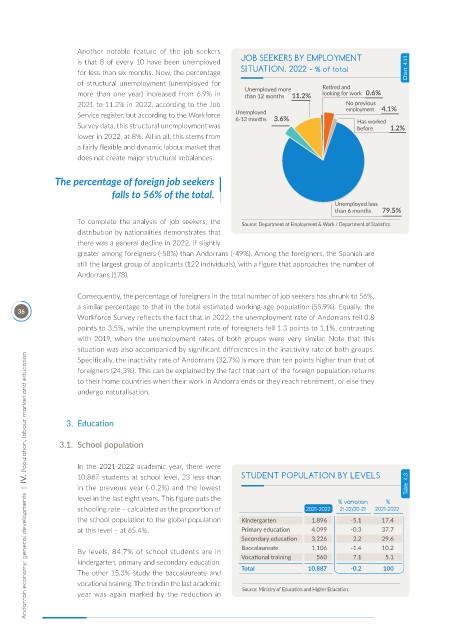
Another  notable  feature  of  the  job  seekers
                     is that 8 of every 10 have been unemployed   JOB SEEKERS BY EMPLOYMENT
                     for less than six months. Now, the percentage   SITUATION. 2022 - % of total           Chart  4.11
                     of  structural  unemployment  (unemployed  for
                     more  than  one  year)  increased  from  6.9%  in
                     2021 to 11.2% in 2022, according to the Job
                     Service register, but according to the Workforce
                     Survey data, this structural unemployment was
                     lower in 2022, at 8%. All in all, this stems from
                     a fairly flexible and dynamic labour market that
                     does not create major structural imbalances.


                The percentage of foreign job seekers
                              falls to 56% of the total.


                     To  complete  the  analysis  of  job  seekers,  the   Source: Department of Employment & Work / Department of Statistics.
                     distribution by nationalities demonstrates that
                     there was a general decline in 2022, if slightly
                     greater among foreigners (-58%) than Andorrans (-49%). Among the foreigners, the Spanish are
                     still the largest group of applicants (122 individuals), with a figure that approaches the number of
                     Andorrans (178).


                     Consequently, the percentage of foreigners in the total number of job seekers has shrunk to 56%,
                     a similar percentage to that in the total estimated working-age population (55.9%). Equally, the
      36
                     Workforce Survey reflects the fact that in 2022, the unemployment rate of Andorrans fell 0.8
                     points to 3.5%, while the unemployment rate of foreigners fell 1.3 points to 1.1%, contrasting
                     with  2019,  when  the  unemployment  rates  of  both  groups  were  very  similar.  Note  that  this
                     situation was also accompanied by significant differences in the inactivity rate of both groups.
        Andorran economy: general developments  |  IV.  Population, labour market and education
                     Specifically, the inactivity rate of Andorrans (32.7%) is more than ten points higher than that of
                     foreigners (24.3%). This can be explained by the fact that part of the foreign population returns
                     to their home countries when their work in Andorra ends or they reach retirement, or else they
                     undergo naturalisation.


                  3.  Education

                 3.1.  School population


                     In  the  2021-2022  academic  year,  there  were
                     10,887 students at school level, 23 less than   STUDENT POPULATION BY LEVELS
                     in the previous year (-0.2%) and the lowest                                            Table  4.3
                     level in the last eight years. This figure puts the                  % variation    %
                     schooling rate – calculated as the proportion of             2021-2022  21-22/20-21  2021-2022
                     the school population to the global population   Kindergarten  1,896    -5.1     17.4
                     at this level – at 65.4%.                   Primary education  4,099    -0.3     37.7
                                                                 Secondary education  3,226   2.2     29.6
                     By levels, 84.7% of school students are in   Baccalaureate    1,106     -1.4     10.2
                                                                                    560
                                                                 Vocational training
                                                                                              7.1
                                                                                                      5.1
                     kindergarten, primary and secondary education.
                     The other 15.3% study the baccalaureate and   Total          10,887     -0.2     100
                     vocational training. The trend in the last academic
                     year  was  again  marked  by  the  reduction  in   Source: Ministry of Education and Higher Education.