
Page 42 - Economic report 2020
P. 42
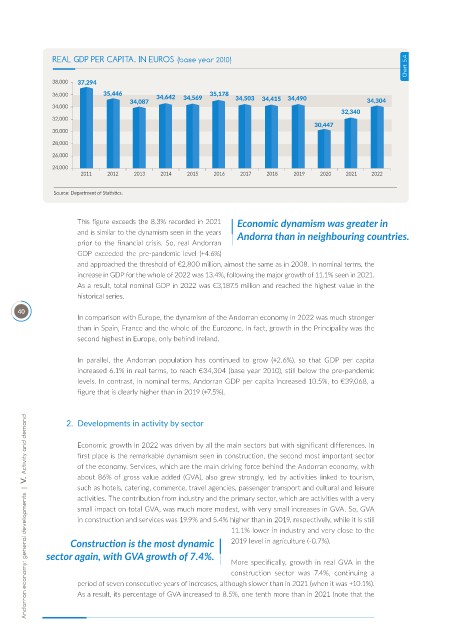
Chart  5.4
               REAL GDP PER CAPITA. IN EUROS (base year 2010)


               Source: Department of Statistics.


                     This figure exceeds the 8.3% recorded in 2021   Economic dynamism was greater in
                     and is similar to the dynamism seen in the years   Andorra than in neighbouring countries.
                     prior to the financial crisis. So, real Andorran
                     GDP  exceeded  the  pre-pandemic  level  (+4.6%)
                     and approached the threshold of €2,800 million, almost the same as in 2008. In nominal terms, the
                     increase in GDP for the whole of 2022 was 13.4%, following the major growth of 11.1% seen in 2021.
                     As a result, total nominal GDP in 2022 was €3,187.5 million and reached the highest value in the
                     historical series.
      40
                     In comparison with Europe, the dynamism of the Andorran economy in 2022 was much stronger
                     than in Spain, France and the whole of the Eurozone. In fact, growth in the Principality was the
                     second highest in Europe, only behind Ireland.

                     In  parallel,  the  Andorran  population  has  continued  to  grow  (+2.6%),  so  that  GDP  per  capita
                     increased 6.1% in real terms, to reach €34,304 (base year 2010), still below the pre-pandemic
                     levels. In contrast, in nominal terms, Andorran GDP per capita increased 10.5%, to €39,068, a
                     figure that is clearly higher than in 2019 (+7.5%).


        Andorran economy: general developments  |  V.  Activity and demand
                  2.  Developments in activity by sector

                     Economic growth in 2022 was driven by all the main sectors but with significant differences. In
                     first place is the remarkable dynamism seen in construction, the second most important sector
                     of the economy. Services, which are the main driving force behind the Andorran economy, with
                     about 86% of gross value added (GVA), also grew strongly, led by activities linked to tourism,
                     such as hotels, catering, commerce, travel agencies, passenger transport and cultural and leisure
                     activities. The contribution from industry and the primary sector, which are activities with a very
                     small impact on total GVA, was much more modest, with very small increases in GVA. So, GVA
                     in construction and services was 19.9% and 5.4% higher than in 2019, respectively, while it is still
                                                              11.1% lower in industry and very close to the
                    Construction is the most dynamic          2019 level in agriculture (-0.7%).
             sector again, with GVA growth of 7.4%.
                                                              More specifically, growth in real GVA in the
                                                              construction  sector  was  7.4%,  continuing  a
                     period of seven consecutive years of increases, although slower than in 2021 (when it was +10.1%).
                     As a result, its percentage of GVA increased to 8.5%, one tenth more than in 2021 (note that the