
Page 21 - Economic report 2020
P. 21
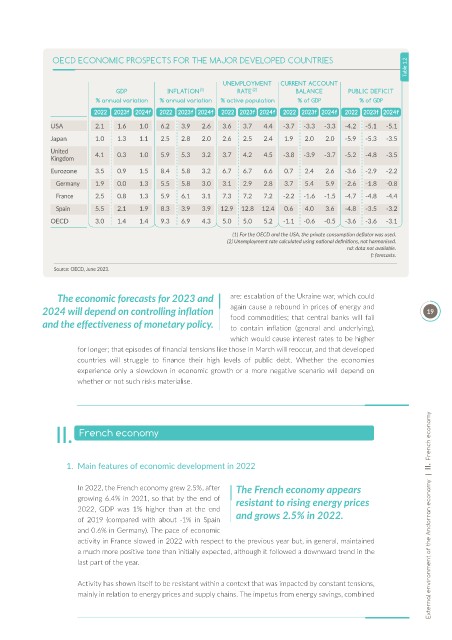
OECD ECONOMIC PROSPECTS FOR THE MAJOR DEVELOPED COUNTRIES
                                                                                                            Table 1.2

                                                            UNEMPLOYMENT   CURRENT ACCOUNT
                                GDP          INFLATION (1)      RATE (2)       BALANCE       PUBLIC DEFICIT
                          % annual variation  % annual variation  % active population  % of GDP  % of GDP
                          2022  2023f 2024f   2022 2023f 2024f  2022 2023f 2024f  2022 2023f 2024f  2022 2023f 2024f
              USA         2.1   1.6   1.0  6.2   3.9  2.6   3.6  3.7  4.4   -3.7  -3.3  -3.3  -4.2  -5.1  -5.1
              Japan       1.0   1.3   1.1  2.5   2.8  2.0   2.6  2.5  2.4   1.9  2.0   2.0  -5.9  -5.3  -3.5
              United
              Kingdom     4.1   0.3   1.0  5.9   5.3  3.2   3.7  4.2  4.5   -3.8  -3.9  -3.7  -5.2  -4.8  -3.5
              Eurozone    3.5   0.9   1.5  8.4   5.8  3.2   6.7  6.7  6.6   0.7  2.4   2.6  -3.6  -2.9  -2.2
                Germany   1.9   0.0   1.3  5.5   5.8  3.0   3.1  2.9  2.8   3.7  5.4   5.9  -2.6  -1.8  -0.8

                France    2.5   0.8   1.3  5.9   6.1  3.1   7.3  7.2  7.2   -2.2  -1.6  -1.5  -4.7  -4.8  -4.4
                Spain     5.5   2.1   1.9  8.3   3.9  3.9  12.9  12.8  12.4  0.6  4.0  3.6  -4.8  -3.5  -3.2
              OECD        3.0   1.4   1.4  9.3   6.9  4.3   5.0  5.0  5.2   -1.1  -0.6  -0.5  -3.6  -3.6  -3.1
                                                              (1) For the OECD and the USA, the private consumption deflator was used.
                                                             (2) Unemployment rate calculated using national definitions, not harmonised.
                                                                                            nd: data not available.
                                                                                                   f: forecasts.

               Source: OECD, June 2023.


                The economic forecasts for 2023 and           are: escalation of the Ukraine war, which could
            2024 will depend on controlling inflation         again cause a rebound in prices of energy and      19
            and the effectiveness of monetary policy.         food  commodities;  that  central  banks  will  fail
                                                              to  contain  inflation  (general  and  underlying),
                                                              which would cause interest rates to be higher
                     for longer; that episodes of financial tensions like those in March will reoccur, and that developed
                     countries  will  struggle  to  finance  their  high  levels  of  public  debt.  Whether  the  economies
                     experience only a slowdown in economic growth or a more negative scenario will depend on
                     whether or not such risks materialise.


                II.   French economy


                   1.  Main features of economic development in 2022

                     In 2022, the French economy grew 2.5%, after   The French economy appears
                     growing 6.4% in 2021, so that by the end of   resistant to rising energy prices
                     2022,  GDP  was  1%  higher  than  at  the  end
                     of  2019  (compared  with  about  -1%  in  Spain   and grows 2.5% in 2022.                   External environment of the Andorran economy  |  II.  French economy
                     and 0.6% in Germany). The pace of economic
                     activity in France slowed in 2022 with respect to the previous year but, in general, maintained
                     a much more positive tone than initially expected, although it followed a downward trend in the
                     last part of the year.

                     Activity has shown itself to be resistant within a context that was impacted by constant tensions,
                     mainly in relation to energy prices and supply chains. The impetus from energy savings, combined