
Page 48 - Economic report 2020
P. 48
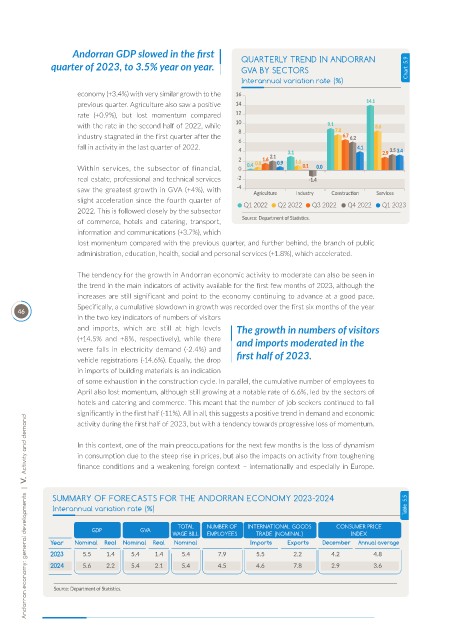
Andorran GDP slowed in the first             QUARTERLY TREND IN ANDORRAN
              quarter of 2023, to 3.5% year on year.             GVA BY SECTORS                             Chart  5.9
                                                                 Interannual variation rate (%)

                     economy (+3.4%) with very similar growth to the
                     previous quarter. Agriculture also saw a positive
                     rate  (+0.9%),  but  lost  momentum  compared
                     with the rate in the second half of 2022, while
                     industry stagnated in the first quarter after the
                     fall in activity in the last quarter of 2022.


                     Within services, the subsector of financial,
                     real estate, professional and technical services
                     saw the greatest growth in GVA (+4%), with
                     slight acceleration since the fourth quarter of   Q1 2022  Q2 2022  Q3 2022  Q4 2022  Q1 2023
                     2022. This is followed closely by the subsector
                     of  commerce,  hotels  and  catering,  transport,   Source: Department of Statistics.
                     information and communications (+3.7%), which
                     lost momentum compared with the previous quarter, and further behind, the branch of public
                     administration, education, health, social and personal services (+1.8%), which accelerated.

                     The tendency for the growth in Andorran economic activity to moderate can also be seen in
                     the trend in the main indicators of activity available for the first few months of 2023, although the
                     increases are still significant and point to the economy continuing to advance at a good pace.
                     Specifically, a cumulative slowdown in growth was recorded over the first six months of the year
      46
                     in the two key indicators of numbers of visitors
                     and  imports,  which  are  still  at  high  levels   The growth in numbers of visitors
                     (+14.5%  and  +8%,  respectively),  while  there   and imports moderated in the
                     were falls in electricity demand (-2.4%) and
                     vehicle registrations (-14.6%). Equally, the drop   first half of 2023.
                     in imports of building materials is an indication
                     of some exhaustion in the construction cycle. In parallel, the cumulative number of employees to
                     April also lost momentum, although still growing at a notable rate of 6.6%, led by the sectors of
                     hotels and catering and commerce. This meant that the number of job seekers continued to fall
                     significantly in the first half (-11%). All in all, this suggests a positive trend in demand and economic
        Andorran economy: general developments  |  V.  Activity and demand
                     activity during the first half of 2023, but with a tendency towards progressive loss of momentum.

                     In this context, one of the main preoccupations for the next few months is the loss of dynamism
                     in consumption due to the steep rise in prices, but also the impacts on activity from toughening
                     finance conditions and a weakening foreign context – internationally and especially in Europe.


               SUMMARY OF FORECASTS FOR THE ANDORRAN ECONOMY 2023-2024
               Interannual variation rate (%)                                                               Table  5.5

                                                TOTAL   NUMBER OF   INTERNATIONAL GOODS   CONSUMER PRICE
                         GDP          GVA
                                              WAGE BILL  EMPLOYEES  TRADE (NOMINAL)          INDEX
              Year   Nominal  Real  Nominal  Real  Nominal         Imports   Exports  December  Annual average
              2023     5.5   1.4    5.4   1.4    5.4      7.9       5.5       2.2       4.2        4.8
              2024     5.6   2.2    5.4   2.1    5.4      4.5       4.6       7.8       2.9        3.6


               Source: Department of Statistics.